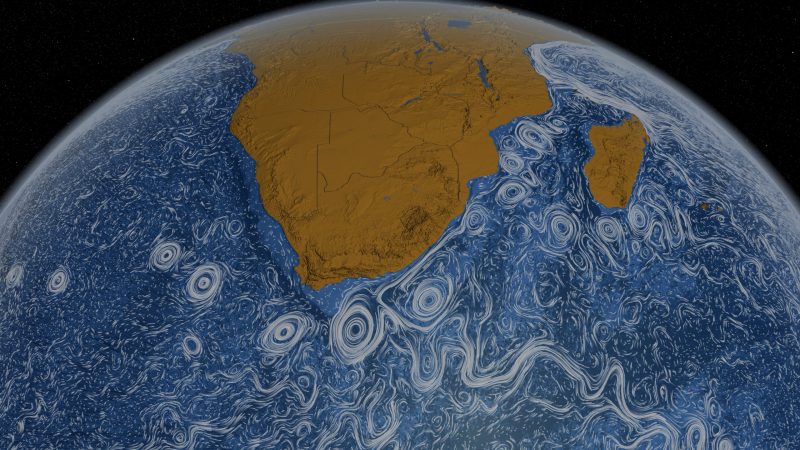
Video: Perpetual Ocean
NASA Goddard Space Flight Center originally released this video in 2012. Called Perpetual Ocean, it shows ocean surface currents around the world during the period from June 2005 through December 2007. The visualization doesn’t include a narration or annotations. It just lets you enjoy the sensational movement of the oceans on this watery planet of ours. NASA said in 2012:
… the goal was to use ocean flow data to create a simple, visceral experience.
I think they did it! Do you? This is one of my all-time favorite NASA videos. NASA also said:
This visualization was produced using NASA/JPL’s computational model called Estimating the Circulation and Climate of the Ocean, Phase II or ECCO2. ECCO2 is a high-resolution model of the global ocean and sea-ice. ECCO2 attempts to model the oceans and sea ice to increasingly accurate resolutions that begin to resolve ocean eddies and other narrow-current systems which transport heat and carbon in the oceans.
The ECCO2 model simulates ocean flows at all depths, but only surface flows are used in this visualization. The dark patterns under the ocean represent the undersea bathymetry [ocean floor]. Topographic land exaggeration is 20x and bathymetric exaggeration is 40x.
There are two versions of this video, by the way, a 20-minute version and a 3-minute version. You can see both in high definition here: https://svs.gsfc.nasa.gov/goto?3827
Read more from NASA about this visualization here

Bottom line: A video visualization of ocean currents around the world from NASA Goddard Space Flight Center. The video shows the period from June 2005 through December 2007.
New research: Ocean rings mystery stems from shape of sea floor
The post Video: Perpetual Ocean will wow you first appeared on EarthSky.
0 Commentaires